Vietnam is an Asian country located on the Indochinese peninsula that is subdivided into 58 provinces. It is one of the fast-growing and developed cities in Asia that is well connected by road, air, and the seaways. This has led to the development of new industrial towns in this area and has allowed the Vietnamese economy to flourish. In the year 2019, the profits earned from exports and imports were 280 billion and 263 billion US dollars respectively. This has helped to increased production from the manufacturing companies and the demands for their products have increased worldwide in recent years. This also has provided a great opportunity for employment and business development all over Vietnam.
Table of Contents
Vietnam Top 10 Export Countries
As per the 2022 record, the total exports of Vietnam are 26.55 billion USD which is about 10.5% less than last year’s figure.
Due to the heavy demand from the manufacturing companies, Vietnam exports its wide range of products to foreign countries. USA holds the top position accounting for 23 % of the export with a value of 61 billion USD.
Next to that, we have China and Japan who are leading in terms of Vietnam’s export countries.
Netherlands and India also count as the export countries with a value of 6.88 and 6.67 billion USD respectively. Few parts of Europe including Germany and the United Kingdom are also included in the list. Most of these countries have well-connected routes and transport system that has improved economic activities in Vietnam in the last few years.
| Sl. No. | Country | Percentage | Value (USD) |
| 1 | USA | 23% | 61 billion |
| 2 | China | 15.6% | 41 billion |
| 3 | Japan | 7.71% | 20 billion |
| 4 | Korea | 7.45% | 19.7 billion |
| 5 | Hong Kong | 2.7% | 7.16 billion |
| 6 | Netherlands | 2.6% | 6.88 billion |
| 7 | India | 2.52% | 6.67 billion |
| 8 | Germany | 2.47% | 6.56 billion |
| 9 | United Kingdom | 2.17% | 5.76 billion |
| 10 | Thailand | 1.9% | 5.05 billion |
Check the Germany export and import goods data.
Here is an infographic that explained the Vietnam’s Export figure beautifully:
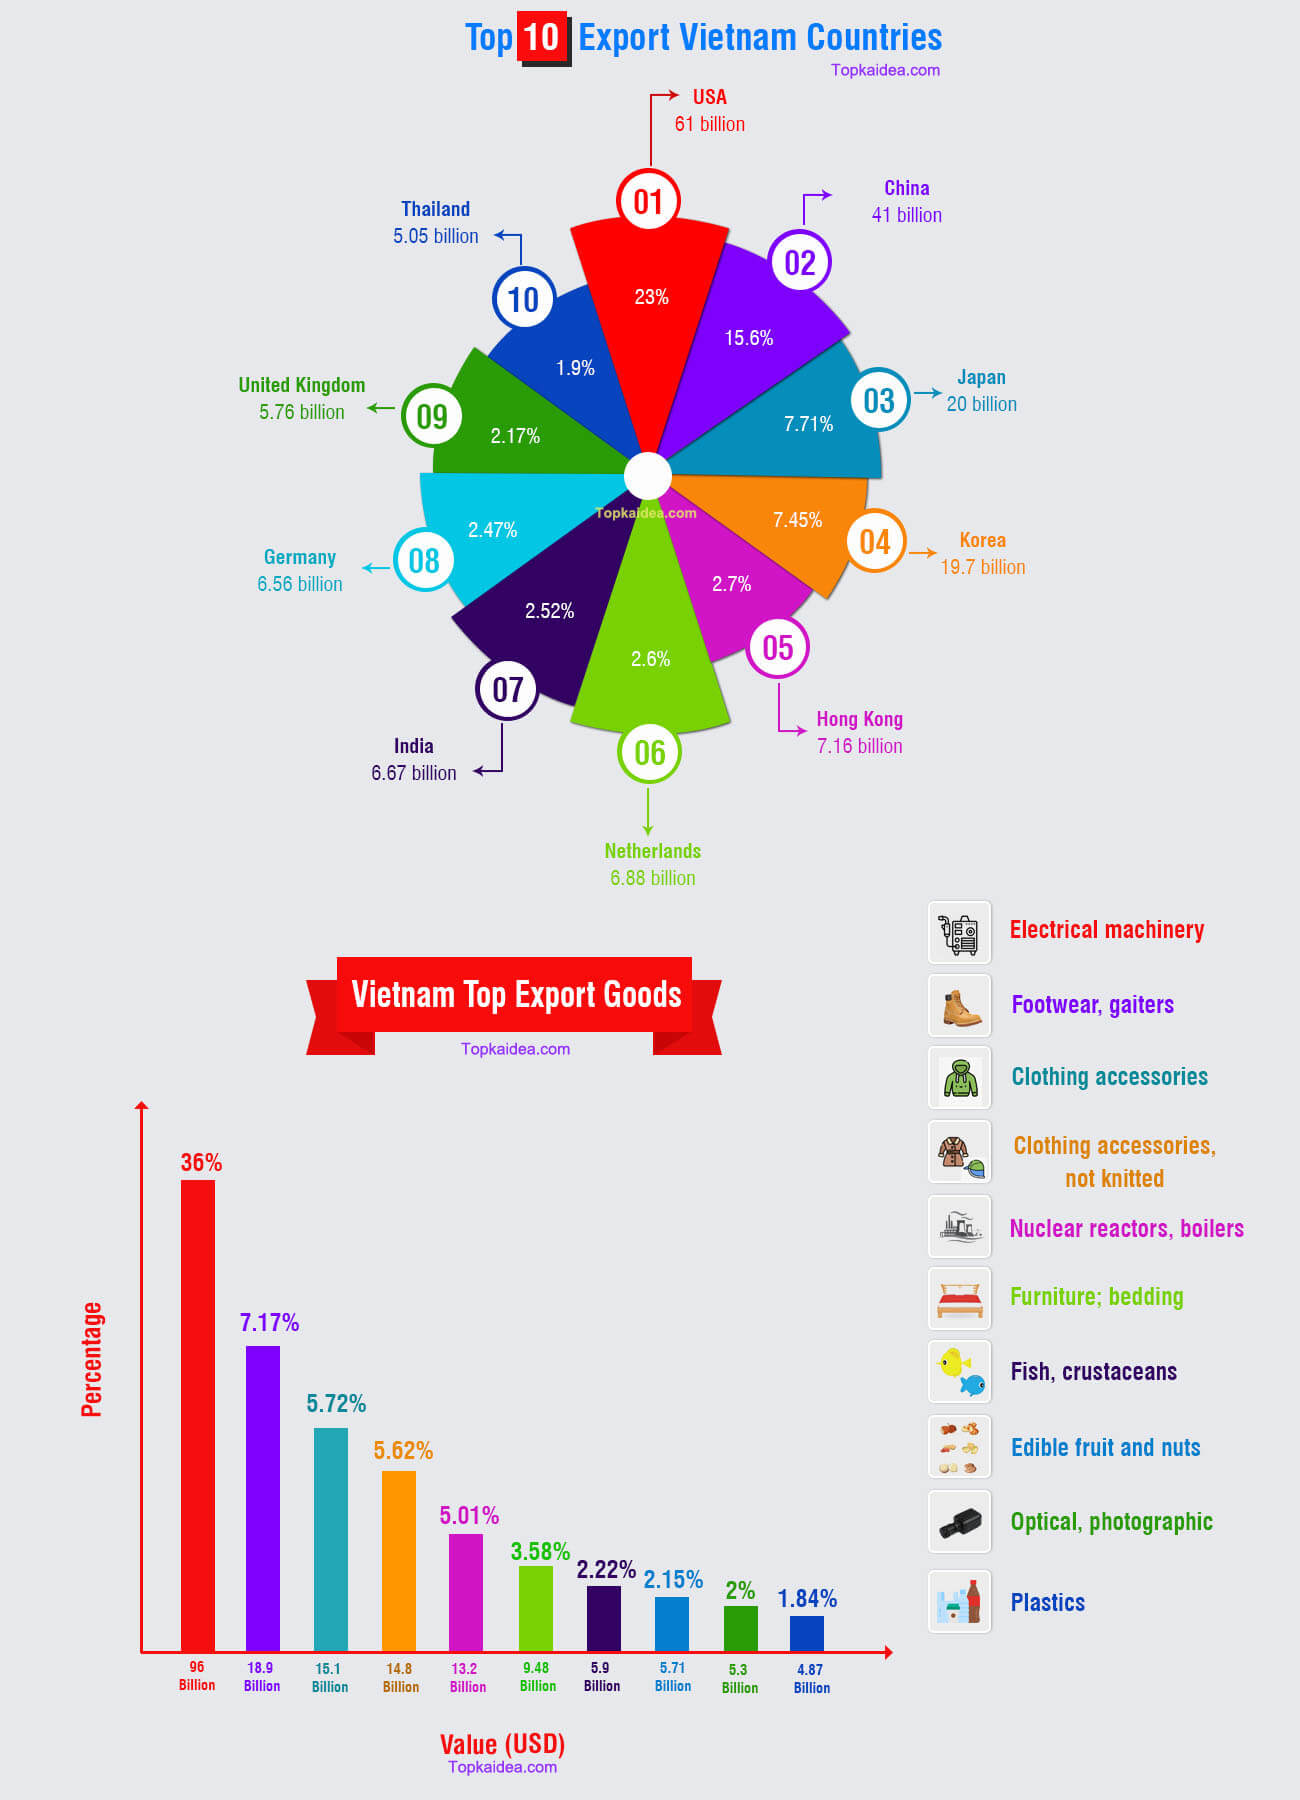
Vietnam Top Export Goods
Vietnam exports a large quantity of electrical and electronic machinery to foreign and neighboring countries accounting for 36% of exports with a value of 96 billion USD. Next to that Vietnam exports footwear and gaiters in large quantities followed by apparel and clothing accessories for men and women of different age groups. Nuclear reactors are also shipped and exported to few European countries that account for 5 percent of Vietnam’s export with a value of 1.2 billion USD.
Due to Vietnam’s unique weather, it also exports edible fruits and nuts to the middle eastern countries. As is it near to the sea, it also exports a variety of fishes and crustaceans’ huge quantities.
| Sl. No. | Export Product | Percentage | Value (USD) |
| 1 | Electrical machinery | 36% | 96 billion |
| 2 | Footwear, gaiters | 7.17% | 18.9 billion |
| 3 | clothing accessories, not knitted, and crocheted | 5.72% | 15.1 billion |
| 4 | clothing accessories, not knitted, and crocheted | 5.62% | 14.8 billion |
| 5 | Nuclear reactors, boilers, machinery, and mechanical appliances | 5.01% | 13.2 billion |
| 6 | Furniture; bedding, mattresses, mattress supports, cushions, and similar stuffed furnishings | 3.58% | 9.48 billion |
| 7 | Fish, crustaceans, and molluscs | 2.22% | 5.9 billion |
| 8 | Edible fruit and nuts | 2.15% | 5.71 billion |
| 9 | Optical, photographic, cinematographic, measuring, checking, precision, medical or surgical instruments, and apparatus | 2% | 5.3 billion |
| 10 | Plastics | 1.84% | 4.87 billion |
Top 10 Import Countries
The 2022 data revealed that the Vietnam imports figure is 27.77 billion USD that is less than 2.4% as compared to the last year.
Vietnam imports huge quantities of products that are required by the population and the industries on a daily basis. China ranks at the top holding 29 percent of Vietnam’s imports with a value of approximately 75 billion USD.
Next to that other Asian countries like Korea and Japan are also included in the list with a value of 46 billion and 19.5 billion USD respectively. The USA accounts for 6 percent of Vietnam’s imports and Malaysia, Thailand and Indonesia also import products to Thailand in bulk quantities via the air and seaways. This has also led to the establishment of friendly relations with the neighboring countries and has helped to increase trade activity worldwide.
- China: 29% – 75 billion
- Korea: 18.5% – 46 billion
- Japan: 7.7% – 19.5 billion
- Other Asia, nes: 5.98% – 15.1 billion
- USA: 5.67% – 14.3 billion
- Thailand: 4.6% – 11.6 billion
- Malaysia: 2.87% – 7.28 billion
- Indonesia: 2.25% – 5.7 billion
- India: 1.78% – 4.51 billion
- Australia: 1.76% – 4.47 billion
Import Goods:
Vietnam imports a variety of products from its neighboring countries via the air and seaways. Electronics and gadgets are imported in high quantities that account for 12.2 percent of the import goods. Petroleum and fine minerals are also imported that are required by the industries and factories on a large scale. Television, cameras, video recorders, and other household electrical appliances have also imported that account for about 3.6 billion USD. Alloy, steel, cigarettes, and other ores are also imported in Vietnam to a significant extent. This has led to the development of new airports and seaports via which the products are imported from foreign countries to Vietnam.
- Electronic integrated circuits and micro assemblies: 12.1% – $30 billion
- Electrical apparatus, telephone sets, and videophones.: 5.25% – $13.3 billion
- Petroleum oils, bituminous minerals, and waste oils: 2.5% – $6.34 billion
- Diodes, transistors, photosensitive semiconductor devices, photovoltaic cells light emitting diodes, and mounted piezo-electric crystals: 1.79% – $4.55 billion
- Petroleum oils: 1.5% – $3.8 billion
- TV, Sound recording television cameras, video cameras, and digital cameras: 1.42% – $3.6 billion
- Flat-rolled products of iron, non-alloy steel, hot-rolled, and clad plated or coated: 1.4% – $3.56 billion
- Printed circuits: 1.4% – $3.55 billion
- Coal, briquettes, ovoid’s and solid fuels: 1.38% – $3.51 billion
Product
- Revenue of Product Exports in 2019: $280B
- Revenue of Product Imports in 2019: $263B
Per Capita
- Revenue of Per Capita Product Exports in 2019: $2.91k
- Revenue of Per Capita Product Imports in 2019: $2.73k
Service Export & Import
- Revenue of Service Exports in 2019: $16.6B
- Revenue of Service Imports in 2019: $18.3B
Source: