Estonia shares its borders with the Gulf of Finland and the Baltic Sea and is one of the most developed and beautiful locations in the world. Due to its unique location and well connectivity, it is home to people of various parts of the world of different cultural backgrounds. Due to the high growth, the revenue of product exports and imports in 2019 was $17 billion and $20.3 billion respectively. Also, the revenue of service exports and imports in 2017 were $6.31 billion and $4.49 billion respectively. This has helped Estonia’s GDP to flourish over the years accounting for $49 billion in 2020.
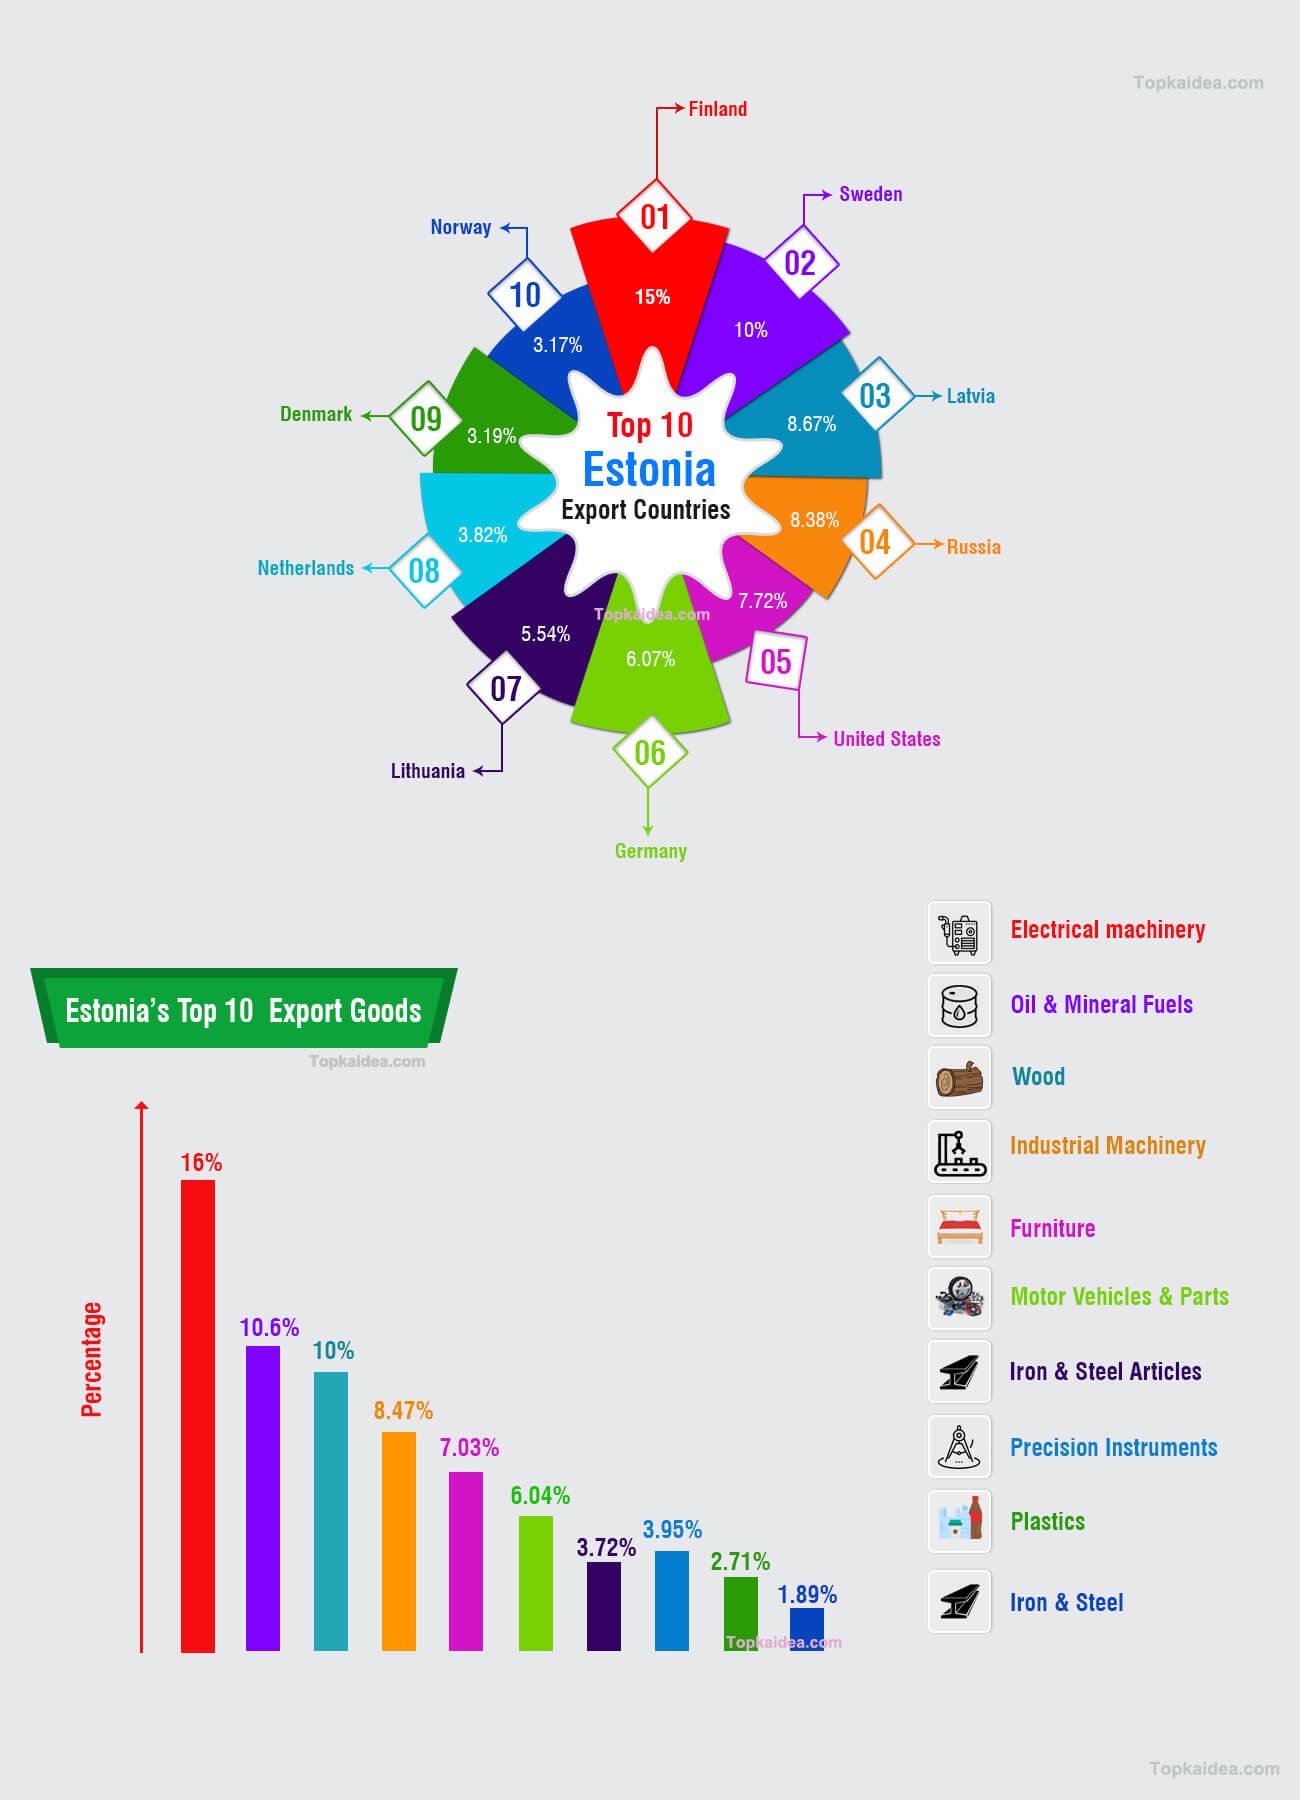
Table of Contents
Estonia’s Top 10 Export Countries 2021
Estonia exports its finished items and products to different countries across the world.
There was a huge export record of Estonia in 2021 that reaches about 1564.57 EUR Million. It also recorded nearly 12.8% of growth in exports in 2020. Moving forward, Estonia recorded again 2% of growth in exports of services during the 1st quarter of 2021.
Finland holds the first position accounting for 15 percent of the total export with a value of 2.54 billion USD. Next to that Sweden holds the second position in terms of exported goods from Estonia with a value of 1.69 billion USD.
Latvia and Russia come next to Sweden with values worth 1.46 and 1.41 billion USD respectively. United States has also included that account for 7.72 percent of the total export with a value of 1.3 billion USD.
Germany and Lithuania are also included in the list with values worth 1.02 billion and 936 million USD respectively. Denmark and Norway also hold a significant position in the exports list accounting for 3.19 percent and 3.17 percent respectively of the total export.
| Sl. No. | Export Countries | Percentage | Value (USD) |
| 1 | Finland | 15% | 2.56 billion |
| 2 | Sweden | 10% | 1.69 billion |
| 3 | Latvia | 8.67% | 1.46 billion |
| 4 | Russia | 8.38% | 1.41 billion |
| 5 | United States | 7.72% | 1.3 billion |
| 6 | Germany | 6.07% | 1.02 billion |
| 7 | Lithuania | 5.54% | 936 million |
| 8 | Netherlands | 3.82% | 646 million |
| 9 | Denmark | 3.19% | 540 million |
| 10 | Norway | 3.17% | 537 million |
Estonia’s Top Export Goods 2021
Estonia includes a variety of items that are exported to foreign countries. Electrical machinery is exported in bulk quantities accounting for 16 percent of the total export with a value of 2.71 billion USD.
Next to that, oil and mineral fuels are also exported which makes a value of 1.79 billion USD.
Wood and Industrial machinery have also exported that account for 10 percent and 8.47 percent of the total export goods.
Furniture holds 7.03 percent of the total export with a value of 1.18 billion USD.
Iron and steel articles account for a value of 668 million USD. Plastics and precision instruments comprising of a value of 458 million and 668 million USD respectively are also exported in significant quantities.
| Sl. No. | Export Product | Percentage | Value (USD) |
| 1 | Electrical Machinery | 16% | 2.71 billion |
| 2 | Oil & Mineral Fuels | 10.6% | 1.79 billion |
| 3 | Wood | 10% | 1.7 billion |
| 4 | Industrial Machinery | 8.47% | 1.43 billion |
| 5 | Furniture | 7.03% | 1.18 billion |
| 6 | Motor Vehicles & Parts | 6.04% | 1.02 billion |
| 7 | Iron & Steel Articles | 3.72% | 628 million |
| 8 | Precision Instruments | 3.95% | 668 million |
| 9 | Plastics | 2.71% | 458 million |
| 10 | Iron & Steel | 1.89% | 320 million |
Estonia’s Top 10 Import Countries 2021
Estonia includes different countries in its import countries list that has helped to establish good relations with foreign countries.
Germany ranks at the top with 9.74 percent of the total imports and a value of 1.72 billion USD.
Next to that, China ranks second with a total value of 1.64 billion USD.
Russia and Finland are also included with a value of 1.61 billion and 1.6 billion USD respectively.
Poland, Lithuania, and other European countries are also included in the import list of Estonia. Sweden accounts for 5.17 percent of the import with a value of 919 million USD. Italy holds 2.86 percent of the total import with a value of 507 million USD.
- Germany:9.74%, 1.72 billion
- China:9.24%, 1.64 billion
- Russia: 9.07%, 1.61 billion
- Finland: 9.06%, 1.6 billion
- Poland: 5.45%, 968 million
- Lithuania: 5.39%, 958 million
- Other Europe: 5.36%, 952 million
- Sweden: 5.17%, 919 million
- Latvia: 4.87%, 865 million
- Italy: 2.86%, 507 million
Import goods 2021
Estonia imports a variety of goods that is required for the process of manufacturing and production. Some of them are used by the local population too on a daily basis.
Electrical machinery and equipment are imported in large quantities that account for 11.5 percent of the total import with a value of 2.04 billion USD.
Mineral fuels have also been imported that accounting for about 11.2 percent of the total imports and a value of 1.99 billion USD.
Vehicle and spare parts are imported that hold a value of 1.67 billion USD. Nuclear reactors, boilers, and other machinery also imported that hold 9.36 percent of the total import with a value of 1.66 billion USD.
Wood and articles have also been imported account for 3.76 percent of the import and a value of 668 million USD. Iron and steel articles are also imported as they are essentially required in the manufacturing industries, accounting for 2.7 percent of the total import with a value worth 479 million USD.
- Electrical machinery and equipment: 11.5%, 2.04 billion
- Mineral fuels, mineral oils: 11.2%, 1.99 billion
- Vehicles, and parts: 9.42%, 1.67 billion
- Nuclear reactors, boilers, machinery, and mechanical appliances: 9.36%, 1.66 billion
- Plastics: 4.45%, 791 million
- Wood and articles: 3.76%, 668 million
- Pharmaceutical products: 3.52%, 625 million
- Iron and steel: 2.97%, 528 million
- Iron or steel articles: 2.7%, 479 million
- Optical, photographic, cinematographic, precision, medical or surgical instruments: 2.49%, 442 million
Product
- Revenue of Product Exports in 2019: $17 billion
- Revenue of Product Imports in 2019: $20.3 billion
GDP
- $30 billion: Nominal, 2020
- $49 billion: PPP, 2020
Per Capita
- Revenue of Per Capita Product Exports in 2019: $12.8k
- Revenue of Per Capita Product Imports in 2019: $15.3k
Service Export & Import
- Revenue of Service Exports in 2017: $6.31 billion
- Revenue of Service Imports in 2017: $4.49 billion
Source:
- Country: Wiki
- Import and Export Data: News.err.ee
Read next: